Overview
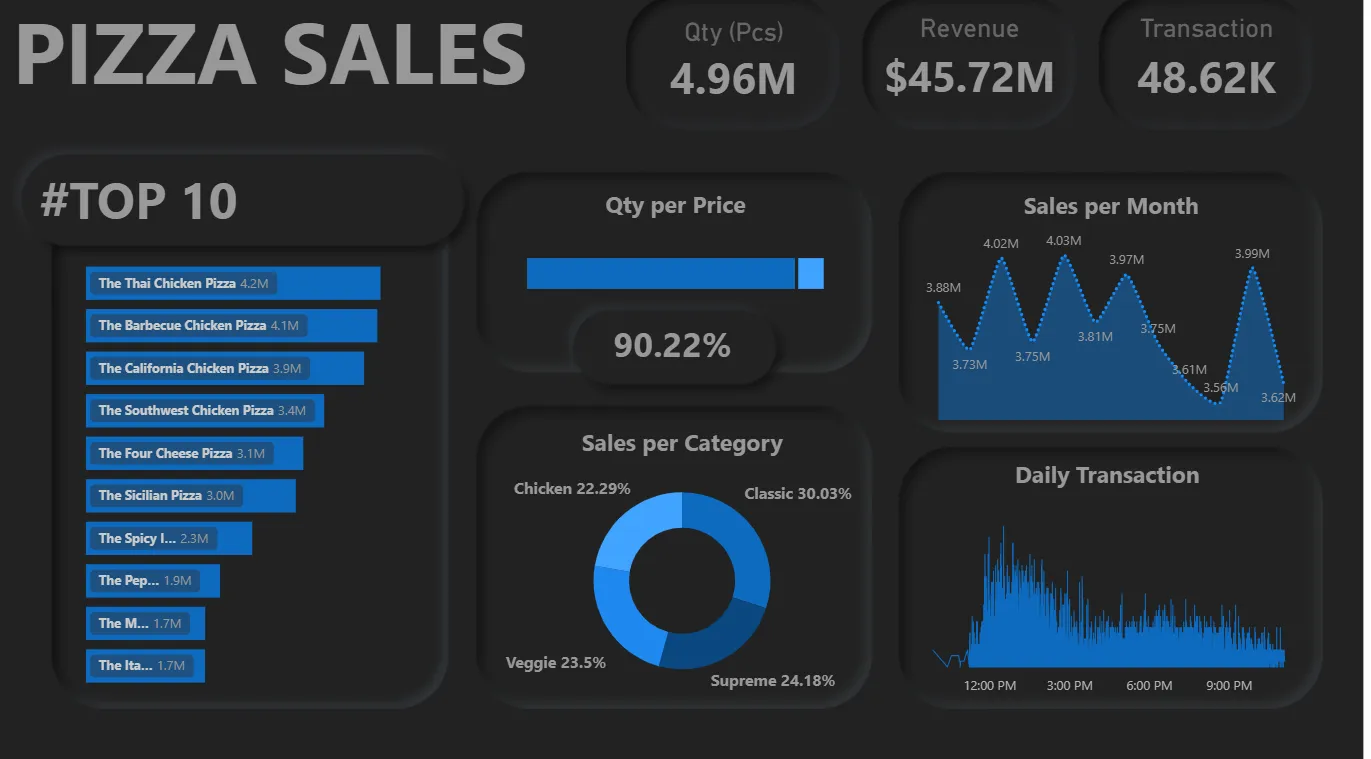
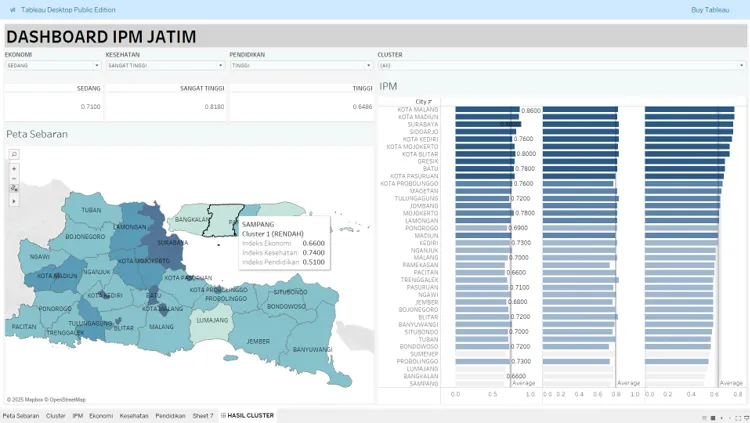
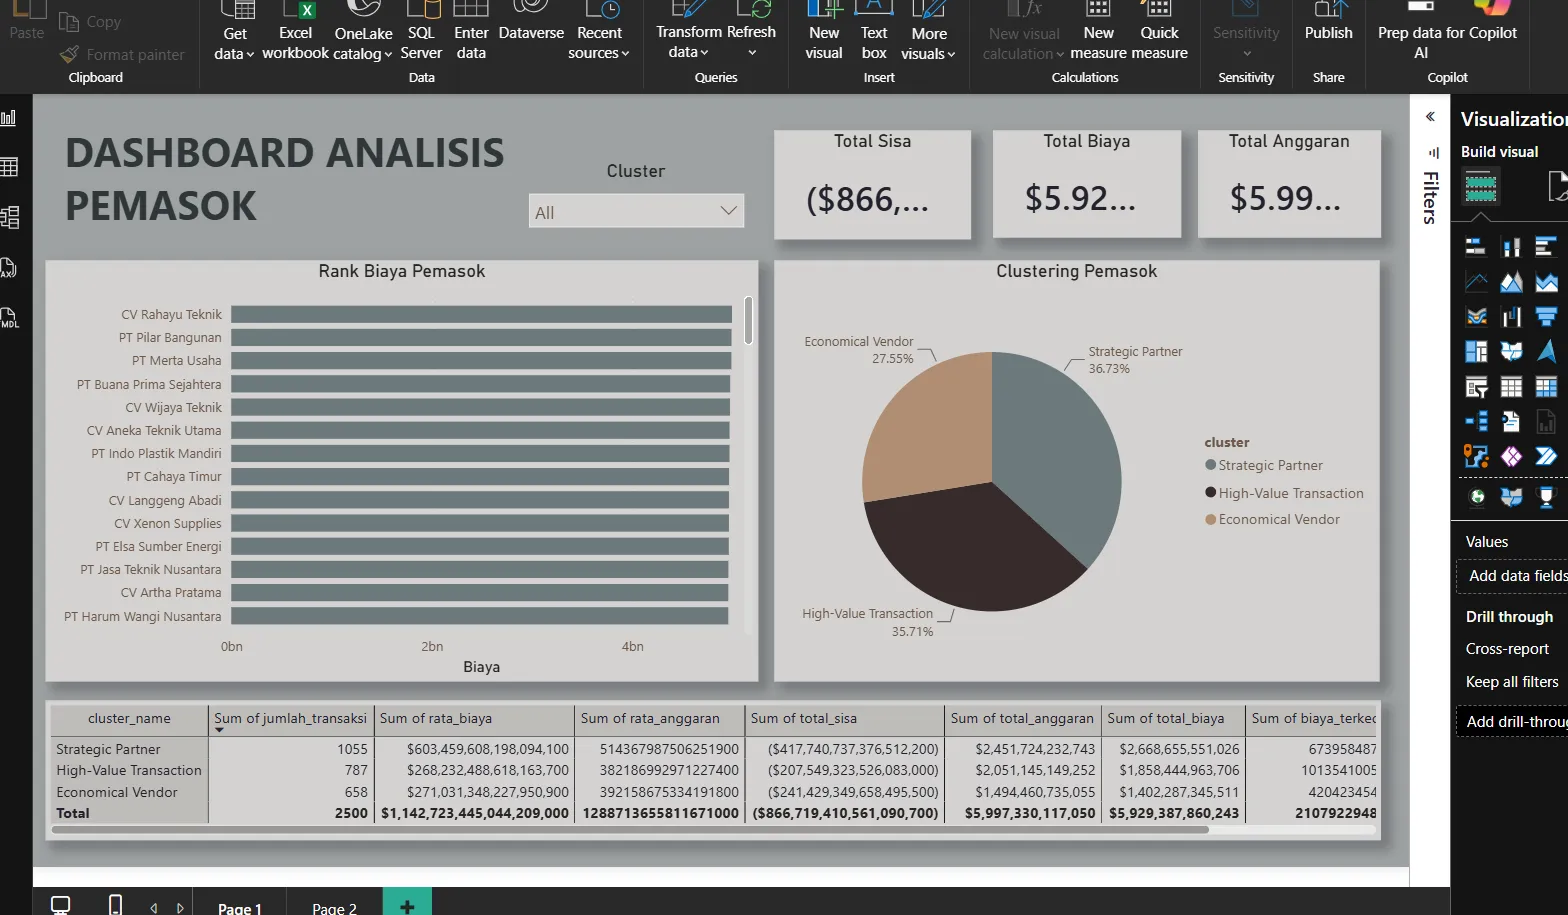
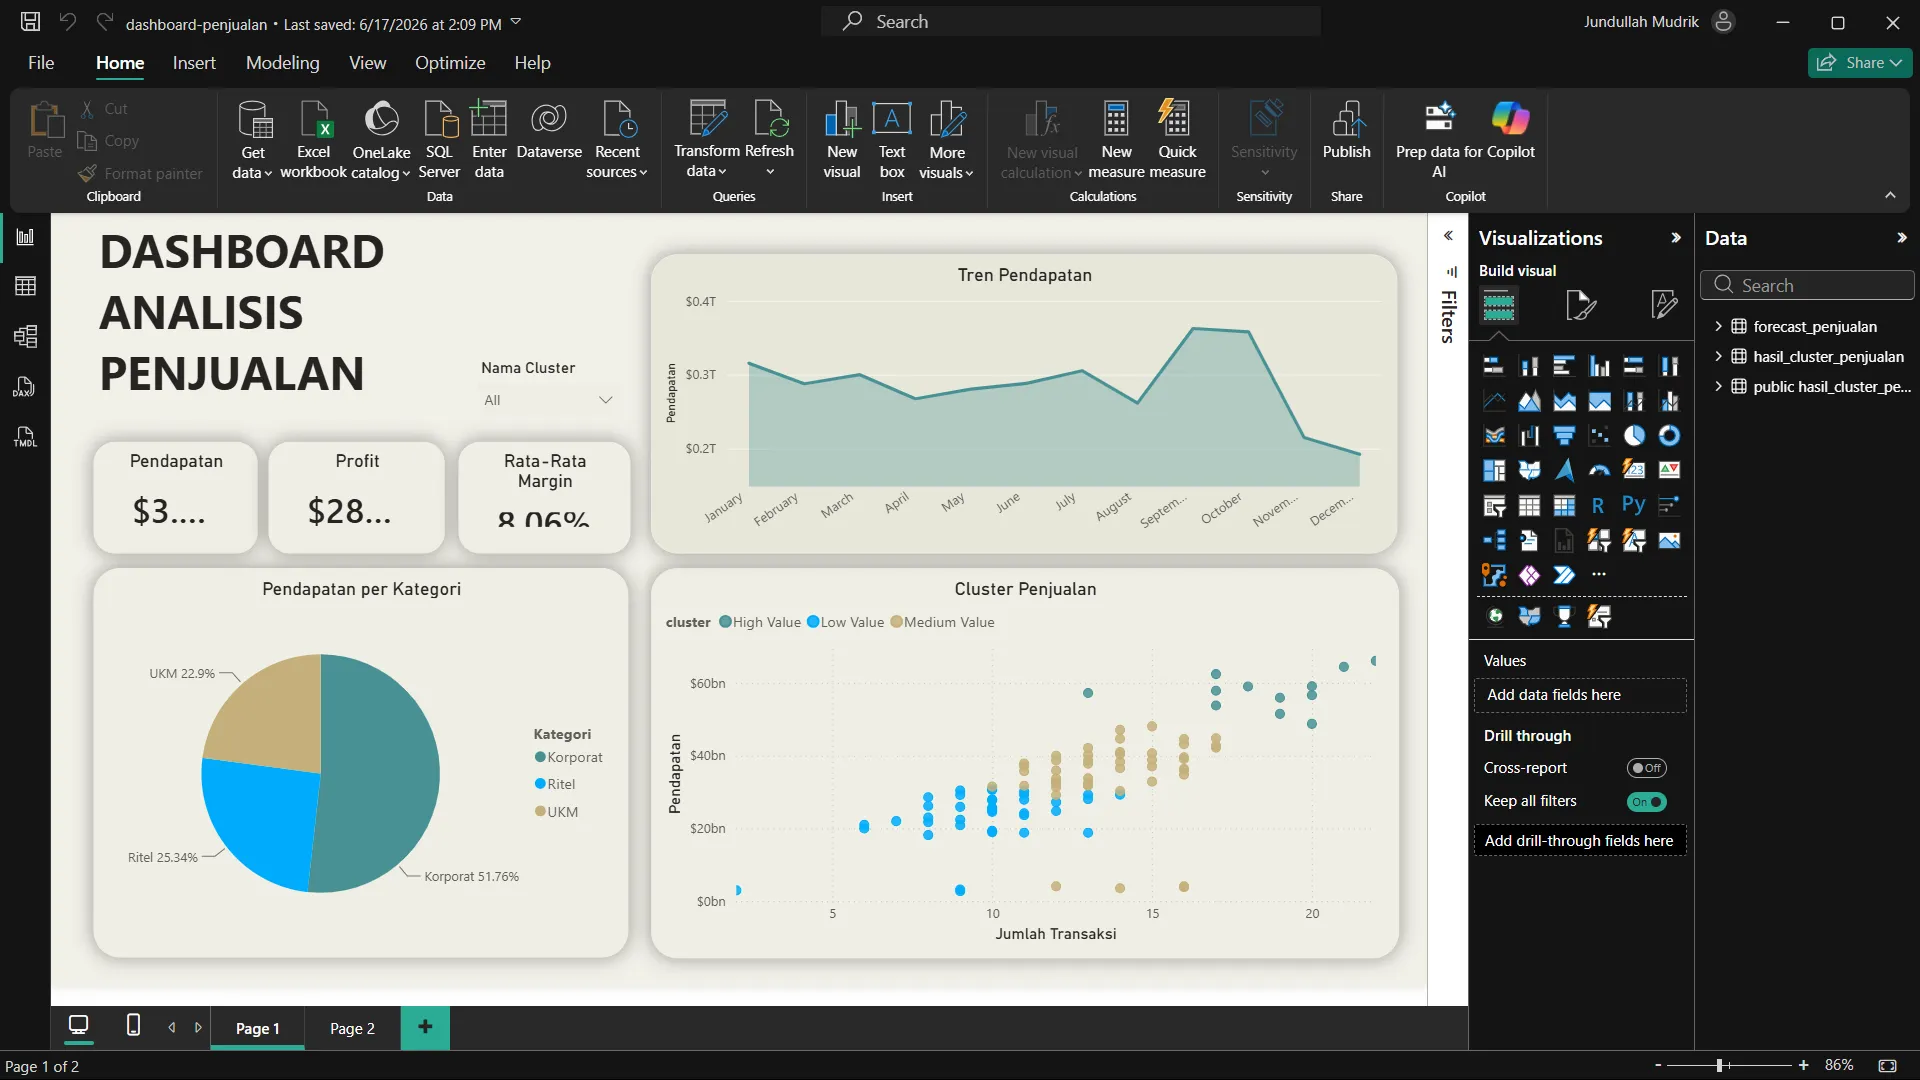
A collection of data visualization projects designed to communicate analytical findings through interactive dashboards. The work uses Power BI and Tableau to transform structured datasets into visual reports that make trends, comparisons, and key performance indicators easier to understand.
Approach
The process begins with understanding the business questions and preparing the underlying data. Relevant metrics and dimensions are then selected before designing dashboard layouts, visual hierarchies, filters, and interactive elements.
Power BI and Tableau are used to create dashboards for exploring performance, trends, categories, and other analytical dimensions. The focus is on making each visualization purposeful rather than simply displaying large amounts of information.
Outcome
The resulting dashboards provide a structured way to explore data and communicate insights. They demonstrate an ability to combine data preparation, visualization, and storytelling into analytical interfaces that support faster understanding and decision making.